Finally, some control.
Look, for years we’ve been fed pre-packaged dashboards for cloud monitoring, mostly slapped together by vendors who think they know what we need. Grafana Cloud’s new customization options for its Cloud Provider Observability suite feel like a breath of fresh air, or at least, a slightly less stale breeze. They’re letting you mess with the defaults for AWS, Azure, and Google Cloud. This means you can finally stop staring at those generic service overviews and instance-level views if they don’t jibe with how your actual team operates. It’s about time someone realized that a one-size-fits-all approach to monitoring is, frankly, a bit insulting.
Who Actually Benefits?
The pitch here is simple: you get prebuilt dashboards. Great. But the real meat is the ability to swap those out. Whether you’ve got your own cherished dashboards already humming along, need something hyper-specific for your team’s workflow, or just want to ditch a panel that’s been uselessly cluttering your screen, Grafana Cloud says you can now do it without leaving the app. This isn’t just about prettying things up; it’s about efficiency. If you can get to the right data faster, you’re less likely to be staring at a blinking red light while your phone rings off the hook with panicked alerts.
It boils down to three key capabilities, they say:
- Quick Links & Default Dashboard: Whatever you pick – preconfigured or your own custom piece of art – becomes the default entry point. Your custom dashboards can also pop up as extra quick links. It’s about setting the stage the way you want it.
- Instance Drill-down: This is where the rubber meets the road. The panels and queries you configure under “Customize the panels…” are precisely what show up when you dig into a single instance. This consistency across different Grafana surfaces – Cloud Provider Observability, Database Observability, the entity graph, and more – sounds like a big win for avoiding that “where am I?” feeling.
- AI-Generated Dashboards: Now, this is where my eyebrows go up. They’re touting AI to generate dashboards with the “right variables and methodology.” Frankly, I’ve seen enough AI-generated code and content to be cautiously optimistic, bordering on deeply skeptical. But, if it can churn out a decent, customizable dashboard that plugs into your existing workflows, it’s less about the magic AI and more about the utility it provides. It’s just another way to get a starting point, presumably with less manual grunt work.
The whole idea is to let you keep the out-of-the-box views when they work, but smoothly plug in your own, or these new AI-created ones, for a different kind of “front door.” And that per-instance drill-down? Tailoring that means you get a consistent view, no matter where you’re looking. It’s an attempt to bridge the gap between generic tooling and your specific operational needs.
Connecting Your Existing Artifacts
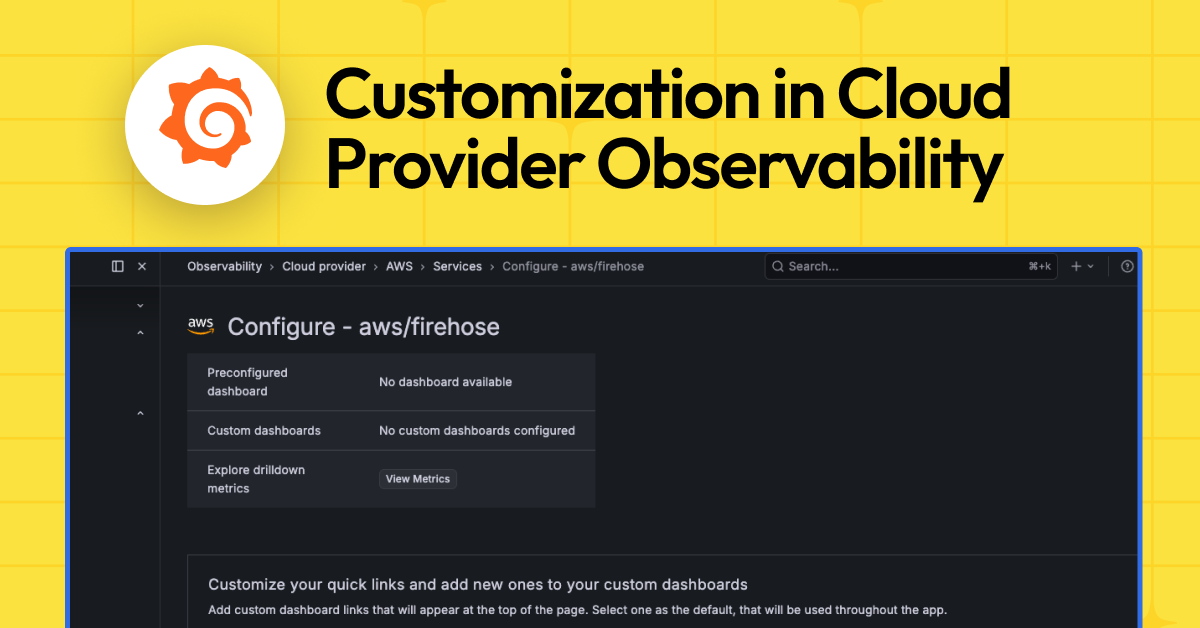
If you’ve already got a dashboard that feels like home for a particular cloud service—say, your internal Amazon RDS or AWS Lambda view—you can now attach it. Make it a quick link, or even better, the default view. This integration happens on the service’s configure page. You’ll see options to select an existing dashboard from your stack and add it. Setting it as default means that whenever you access that service from the services tab or the entity graph, your custom dashboard loads first. The original, preconfigured dashboard? It doesn’t disappear; it’s just tucked away, available if you decide you miss it.
The AI Gambit: Worth the Hype?
Then there’s the “Generate with AI” flow. If you haven’t built a dashboard from scratch and don’t have one lying around, this option aims to create one for you. They mention RED and USE-style panels—standard observability metrics. You access it from the same configure page. Click “Generate with AI,” get a dashboard that’s supposedly ready-to-use, save it, and then add it to your service’s quick links. You can then set it as the default, just like a manually created one. It’s a fascinating proposition. Will it produce something genuinely useful, or just another layer of corporate jargon translated into charts? We’ll see.
Drilling Down: The Devil’s in the Details
Perhaps the most practically impactful change is the ability to customize the instance drill-down view. When you click into a specific instance—a single RDS database, a Lambda function, a virtual machine—you get a set of panels. Now, you can choose exactly which panels appear, add your own custom queries, reorder them, and even tweak units and legend formats. This level of granular control directly impacts how quickly you can diagnose issues. It’s about making sure the information you need most is front and center when a specific piece of infrastructure is throwing a fit. The configuration lives on that service’s configure page, under “Customize the panels that will be displayed in the drilldown instance view.” You can toggle custom panels on, select from a list of available metrics and queries, and add your own. It sounds like they’re finally giving you the tools to stop wading through irrelevant data.
The Bottom Line: Control Where It Counts
This isn’t just a UI tweak; it’s a strategic move to empower users. For too long, we’ve been at the mercy of vendor-defined observability. Grafana Cloud’s move to allow deep customization—from the top-level service view down to the per-instance metrics—is a significant step towards making these tools truly fit the operational reality of complex cloud environments. It’s about giving users agency in how they monitor their systems. And in the world of cloud ops, agency often translates directly to reduced downtime and faster incident response. Who’s making money? Grafana Cloud, by making its platform stickier and more indispensable to the organizations already paying for cloud services. Smart.
Is This AI Feature Actually Useful?
The AI-generated dashboard feature is still in its early days. While it promises to speed up the creation of dashboards with relevant metrics, the quality and relevance of the output will vary. It’s best approached as a time-saver for generating a starting point rather than a definitive solution. Users will likely still need to refine the AI-generated dashboards to perfectly match their specific needs and the nuances of their cloud environments. Its true value will be in how well it integrates into existing workflows and how much manual post-generation editing it truly reduces.
Why Does This Matter for Developers?
For developers, particularly those responsible for deploying and managing applications on cloud platforms, this means more control over their monitoring experience. Instead of relying on generic dashboards that might obscure critical application-level metrics or include excessive infrastructure noise, developers can now tailor views to show exactly what impacts their code. This can lead to faster debugging, better performance tuning, and a clearer understanding of how their applications are behaving in production. It democratizes the observability tooling, putting more power into the hands of the people who build and break things.
🧬 Related Insights
- Read more: Linux’s March 2026 App Surge: FreeCAD, Blender Lead Charge
- Read more: Canada’s Open Source AI Gambit: Snowbound Labs to Economic Liftoff
Frequently Asked Questions
What does Cloud Provider Observability in Grafana Cloud do?
Cloud Provider Observability in Grafana Cloud provides prebuilt and customizable dashboards for monitoring AWS, Azure, and Google Cloud infrastructure, service overviews, and individual instances.
Can I use my own dashboards with Grafana Cloud?
Yes, Grafana Cloud allows you to connect and set your existing dashboards as default views for specific cloud services.
Is the AI dashboard generator mandatory?
No, the AI-generated dashboard feature is optional. You can still create dashboards manually or use the preconfigured options.